Prometheus监控Windows主机
2023/8/13...大约 1 分钟
Prometheus监控Windows主机
1. 基本说明
使用Prometheus监控Windows主机与Linux主机方式相近,均借助社区的Exporter采集数据,并通过暴露接口供Prometheus获取主机数据。
监控Linux的Exporter地址为:https://github.com/prometheus/node_exporter。
监控Windows主机的Exporter地址为:https://github.com/prometheus-community/windows_exporter。
2. 安装Windows Exporter
无论是监控Linux还是Windows,对应的exporter都提供了二进制文件和msi文件。对于Windows系统,可直接从以下地址下载最新的msi文件,并安装到相应的Windows主机上。
MSI文件下载地址:https://github.com/prometheus-community/windows_exporter/releases
下载时,选择对应的msi文件,如下所示: 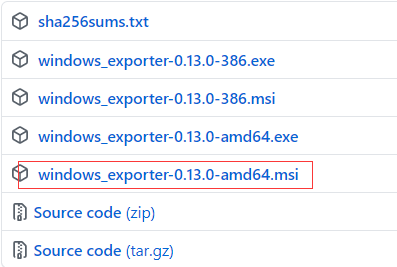
下载完成后,双击该文件即可完成安装,安装界面如下: 
安装完成后,可在任务管理器中看到对应的进程: 
安装完成后,可测试是否有数据产生。默认情况下,其端口为9182,路径为metrics,测试页面如下: 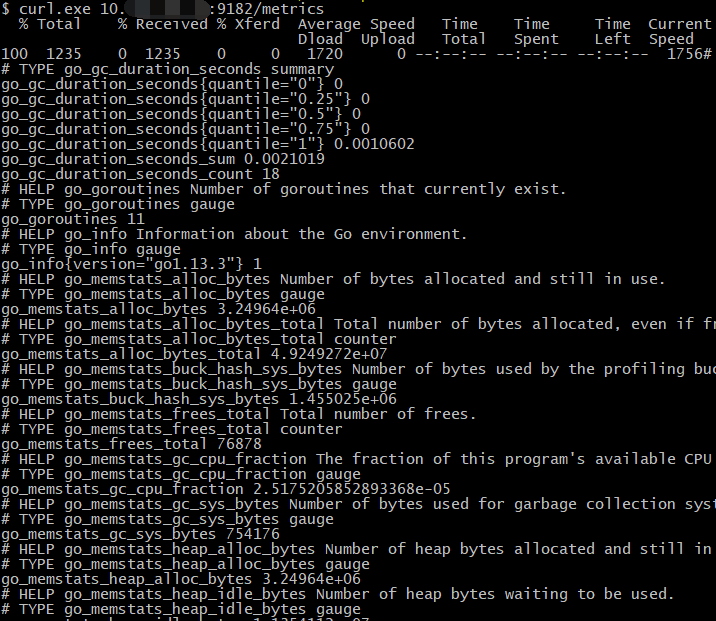
3. 配置Prometheus采集数据
在Prometheus的配置文件中添加如下配置:
- job_name: 'WindowsServerMonitor'
  static_configs:
    - targets:
      - "10.101.3.3:9182"
      labels:
        server_type: 'windows'
  relabel_configs:
    - source_labels: [__address__]
      target_label: instance
配置完成后,检查Prometheus是否有数据产生,示例如下: 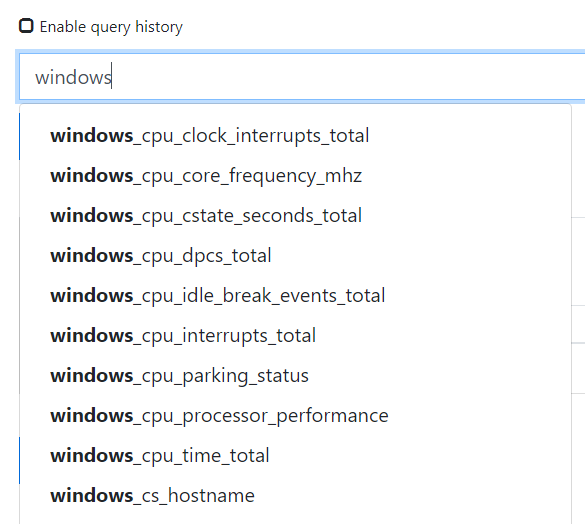
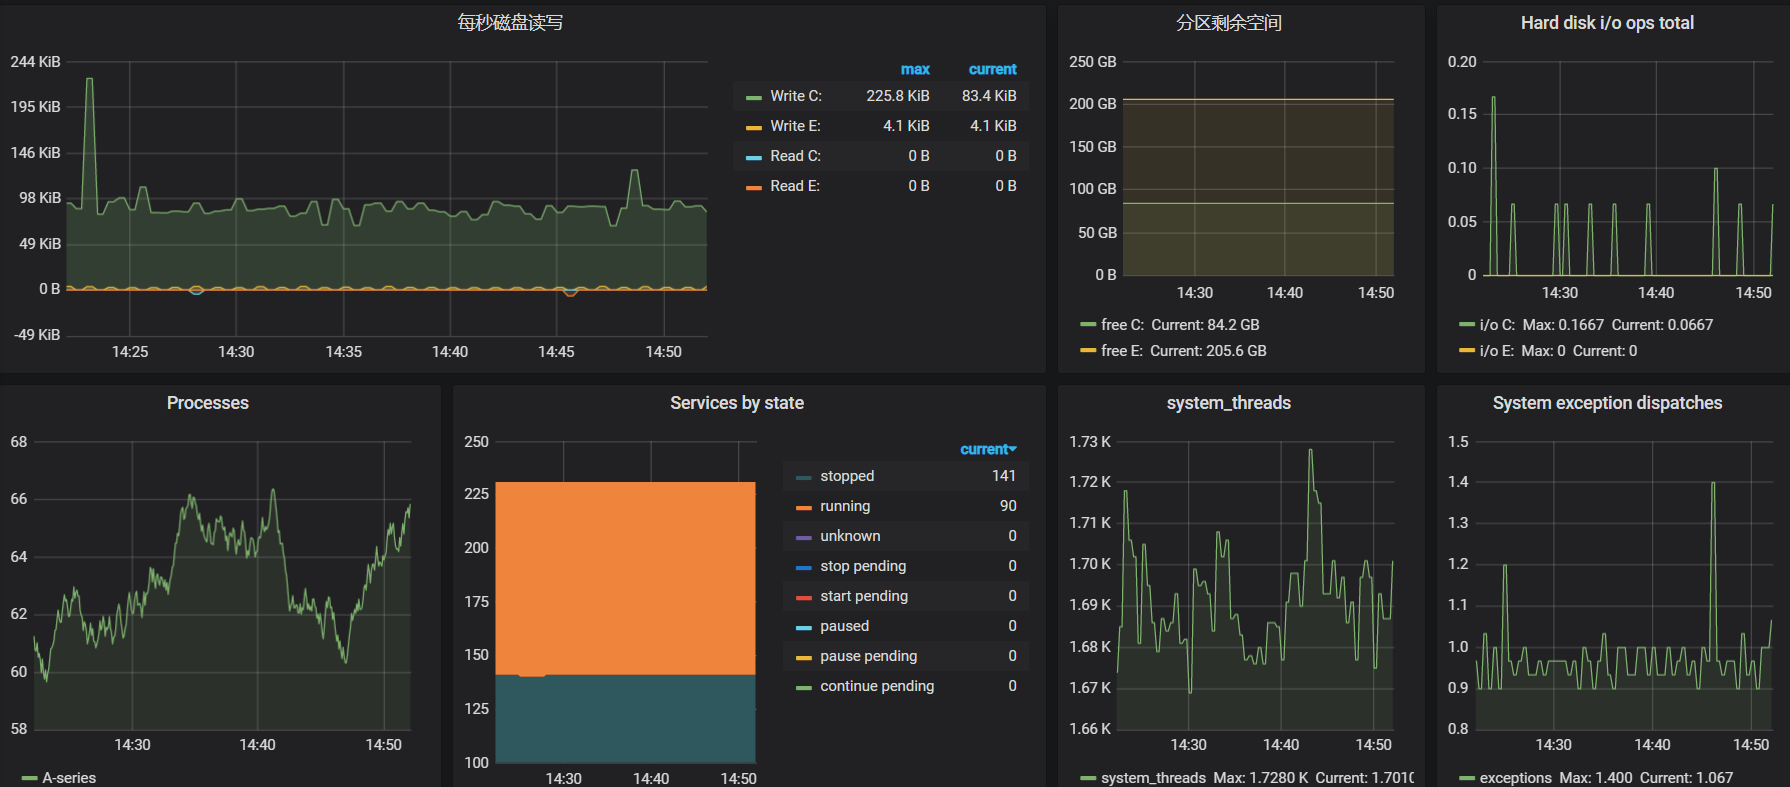
4. 配置Grafana展示数据
首先,从以下地址下载模板:https://grafana.com/grafana/dashboards/12566
数据展示效果如下: 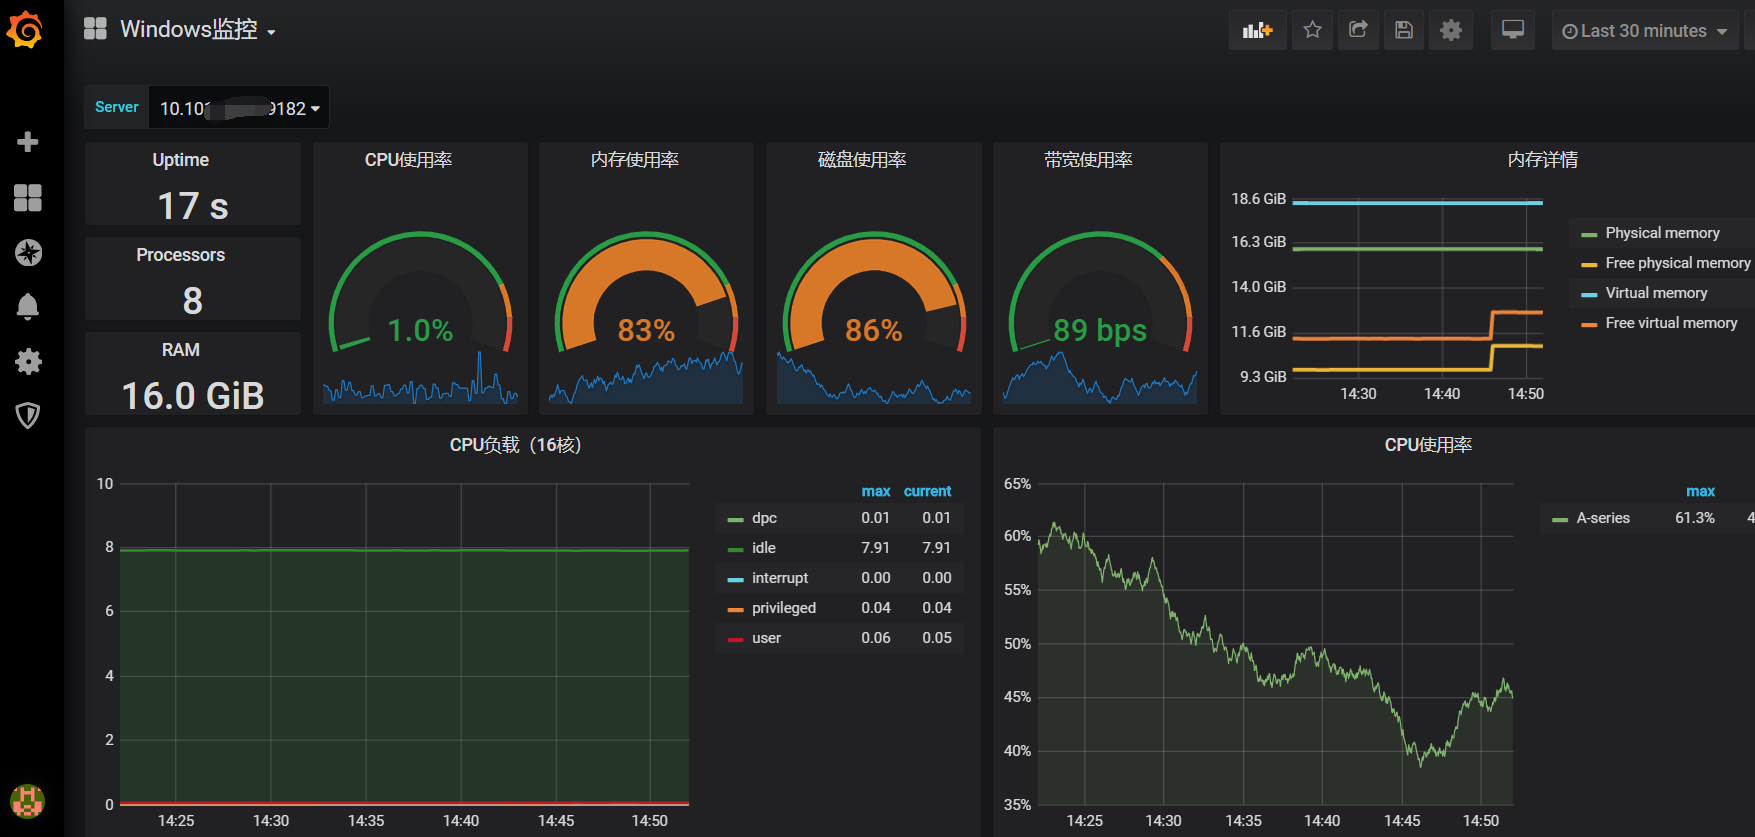
更新日志
2024/12/24 16:33
查看所有更新日志
a0de6-于392a5-于