ELK日志分析系统
2023/8/13...大约 6 分钟
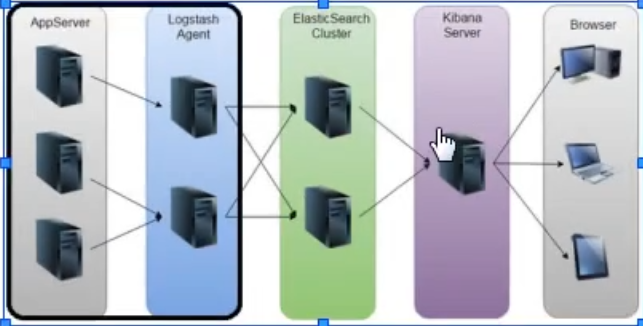
ELK日志分析系统


E Elasticsearch
弹性搜索,日志存储
L Logstash
日志收集
K Kibana
日志展示
实战
环境
操作系统优化
systemctl stop firewalld
systemctl disable firewalld
setenforce 0
sed -i 's/SELINUX.*/SELINUX=disabled/g' /etc/selinux/conf

# 时间一致

# 域名解析
172.16.100.18 elk-node1
172.16.100.21 elk-node2
master-slave模式

内存:大于2G
Elasticsearch
基础环境安装 node1 node2同时进行
[root@node1 ~]# rpm --import https://packages.elastic.co/GPG-KEY-elasticsearch
[root@node1 ~]# cd /etc/yum.repos.d/
[root@node1 yum.repos.d]# vi elasticsearch.repo
[elasticsearch-2.x]
name=Elasticsearch repository for 2.x packages
baseurl=http://packages.elastic.co/elasticsearch/2.x/centos
gpgcheck=1
gpgkey=http://packages.elastic.co/GPG-KEY-elasticsearch
enable=1

[root@node1 ~]# yum list       #查看yum清单
[root@node1 ~]# yum install elasticsearch -y    #安装elasticsearch
[root@node1 ~]# yum install java -y      #安装Java
[root@node1 ~]# java -version           #查看Java版本
openjdk version "1.8.0_131"
OpenJDK Runtime Environment (build 1.8.0_131-b12)
OpenJDK 64-Bit Server VM (build 25.131-b12, mixed mode)

修改配置文件
[root@node1 yum.repos.d]# vi /etc/elasticsearch/elasticsearch.yml
17行 集群名称
cluster.name: elastic

23行 节点名称
node.name: linux-node1

33行 工作目录
path.data: /data/es-data
path.logs: /var/log/elasticsearch/

43行 防止交换swap分区
bootstrap.memory_lock: true

54行 监听网络
network.host: 0.0.0.0

58行 端口
http.port: 9200

关闭组播
discovery.zen.ping.multicast.enabled: false
单播
discuvery.zen.ping.unicast.hosts: ["elk-host1","elk-host2"]


创建目录及开启服务
[root@node1 yum.repos.d]# mkdir -p /data/es-data
[root@node1 yum.repos.d]# chown -R elasticsearch:elasticsearch /data/es-data
[root@node1 yum.repos.d]# systemctl start elasticsearch.service
[root@node1 yum.repos.d]# netstat -anpt | grep 9200
tcp6       0      0 :::9200                 :::*                    LISTEN      54134/java

测试
http://20.0.0.10:9200

[root@node1 yum.repos.d]# curl -i -XGET 'http://20.0.0.20:9200/_count?pretty' -d '{
> "query": {
>     "match_all": {}
> }
> }'
HTTP/1.1 200 OK       #输出项
Content-Type: application/json; charset=UTF-8
Content-Length: 95

{
  "count" : 0,
  "_shards" : {
    "total" : 0,
    "successful" : 0,
    "failed" : 0
  }
}

[root@node2 yum.repos.d]# curl -i -XGET 'http://20.0.0.10:9200/_count?pretty' -d '{
> "query": {
>     "match_all": {}
> }
> }'
HTTP/1.1 200 OK      #输出项
Content-Type: application/json; charset=UTF-8
Content-Length: 95

{
  "count" : 0,
  "_shards" : {
    "total" : 0,
    "successful" : 0,
    "failed" : 0
  }
}
安装插件1
elk-node1/node2都安装
安装Elasticsearch插件
[root@node1 yum.repos.d]# /usr/share/elasticsearch/bin/plugin install mobz/elasticsearch-head
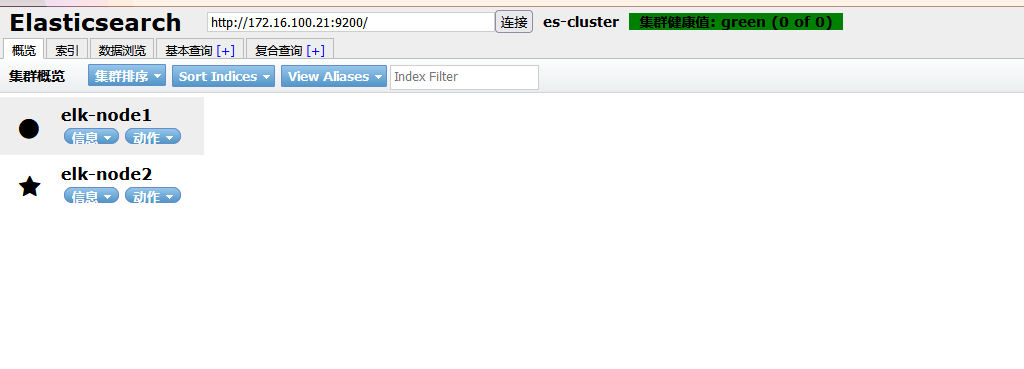
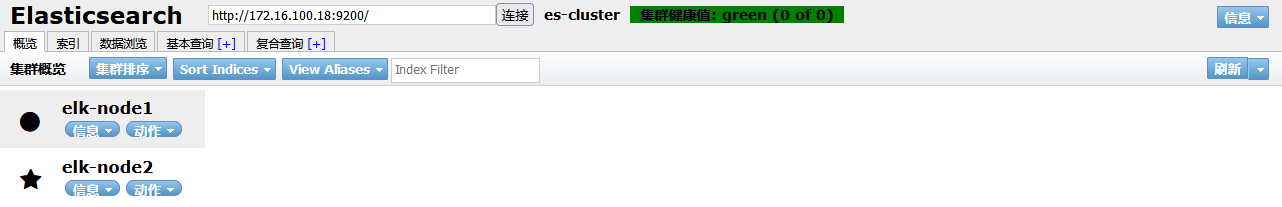
测试
http://20.0.0.10:9200/_plugin/head/elasticsearch集群部署
[root@node1 yum.repos.d]# vi /etc/elasticsearch/elasticsearch.yml
69行 单播列表自动发现机制
discovery.zen.ping.unicast.hosts: ["20.0.0.10", "20.0.0.20"]
重启服务
[root@node1 yum.repos.d]# systemctl restart elasticsearch.service
测试
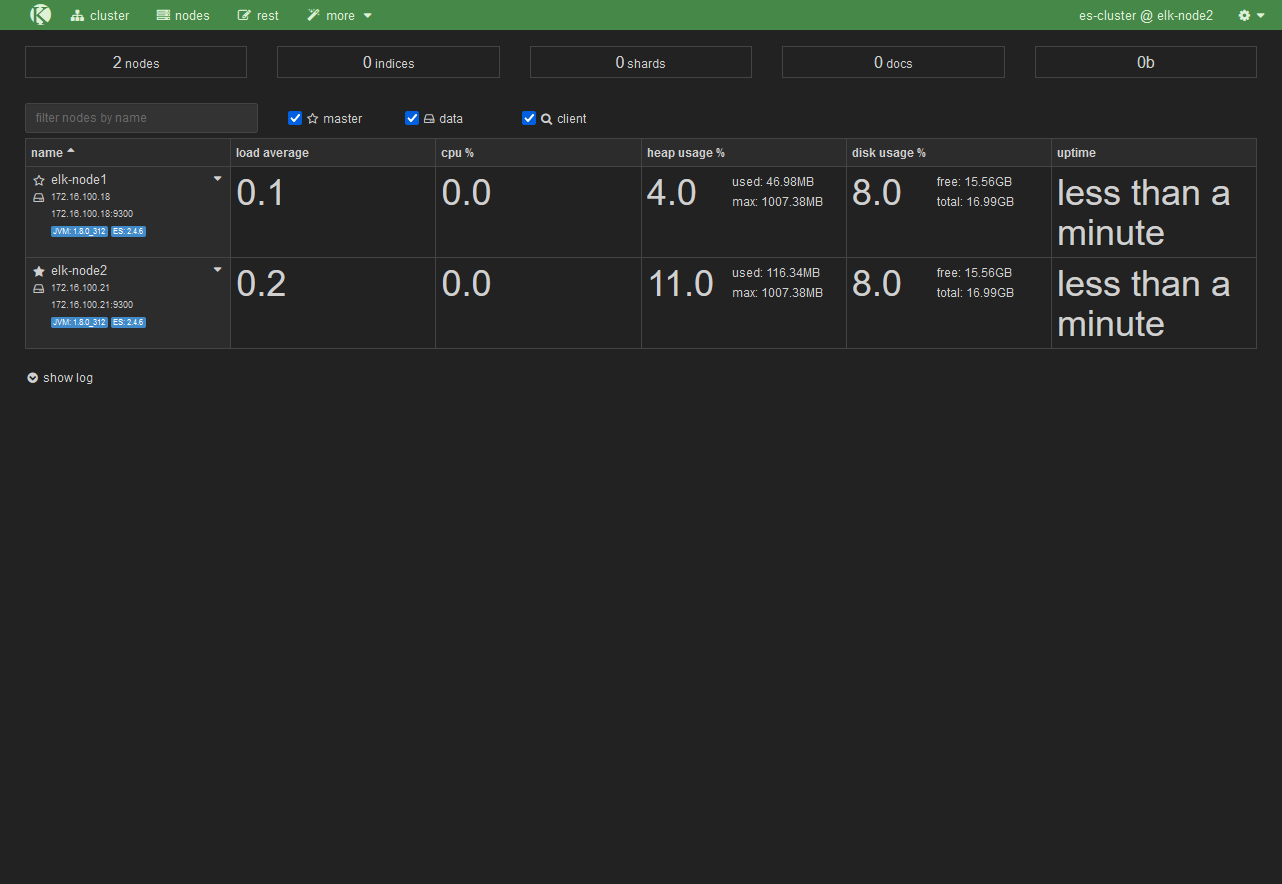
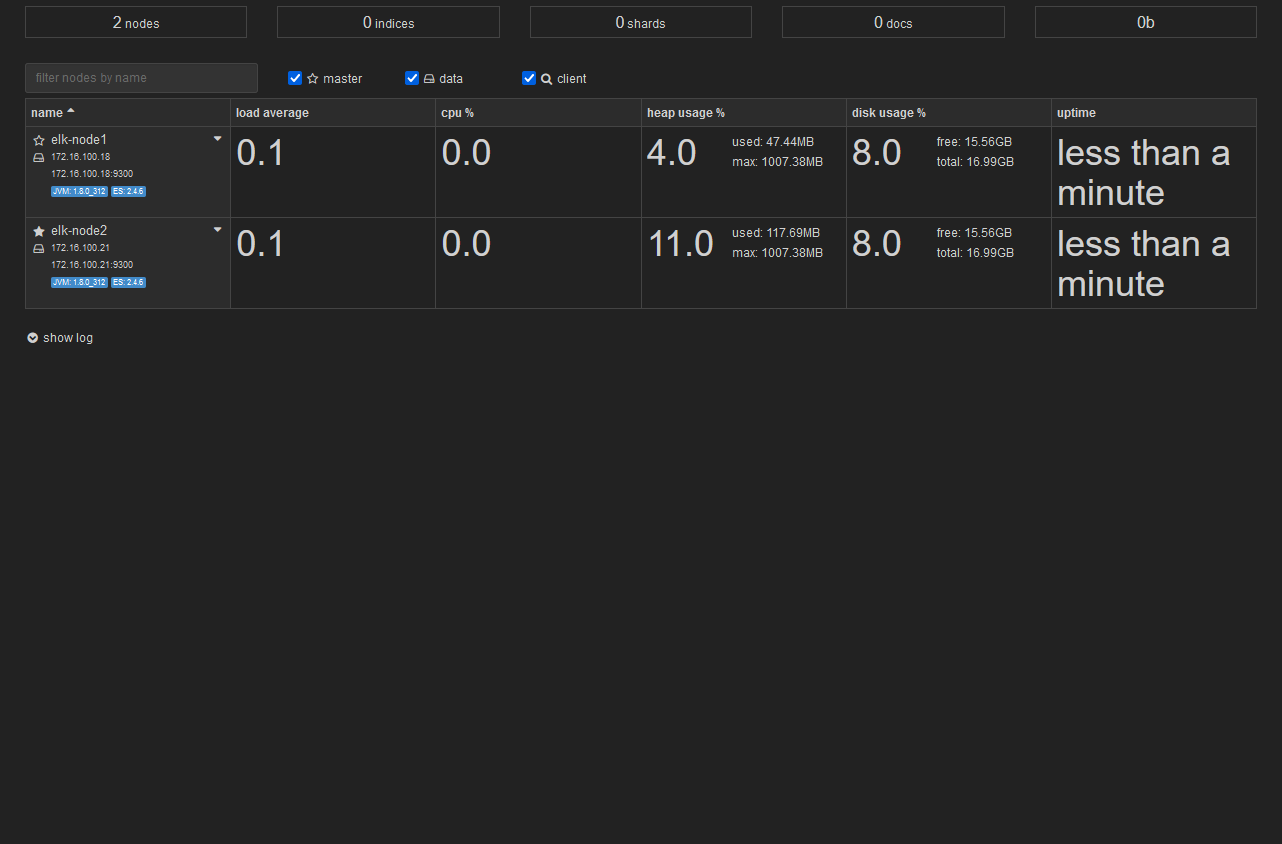
http://20.0.0.10:9200/_plugin/head/安装插件2
安装监控组件
[root@node1 elasticsearch]# /usr/share/elasticsearch/bin/plugin install lmenezes/elasticsearch-kopf
chown -R elasticsearch:elasticsearch /usr/share/elasticsearch/plugins
两台服务器均可插件测试
Logstash
Apache
安装httpd并开启服务
[root@node1 elasticsearch]# rpm --import https://packages.elastic.co/GPG-KEY-elasticsearch
[root@node1 elasticsearch]# vi /etc/yum.repos.d/logstash.repo
[logstash-2.1]
name=Logstash repository for 2.1.x packages
baseurl=http://packages.elastic.co/logstash/2.1/centos
gpgcheck=1
gpgkey=http://packages.elastic.co/GPG-KEY-elasticsearch
enable=1

安装Logstash
[root@node1 elasticsearch]# yum install logstash -y

安装java环境,没有自带安装使用yum -y install java安装
[root@apache ~]# yum -y install java
[root@apache ~]# java -version
openjdk version "1.8.0_131"
OpenJDK Runtime Environment (build 1.8.0_131-b12)
OpenJDK 64-Bit Server VM (build 25.131-b12, mixed mode)
[root@apache bin]# ln -s /opt/logstash/bin/logstash /usr/local/bin/

logstash(apache)与elasticsearch(node)功能是否正常,做对接测试
[root@apache bin]# logstash -e 'input { stdin{} } output { stdout{} }'
Settings: Default filter workers: 1
Logstash startup completed
www.baidu.com
2020-11-18T07:53:59.480Z apache www.baidu.com
logstash命令选项解释:
-f:指定logstash的配置文件,根据配置文件配置logstash
-e:后面跟着字符串,该字符串可以被当做logstash的配置(如果是“ ”,则默认使用stdin做输入,stdout为输出)
-t:测试配置文件是否正确,然后退出
#输入采用标准输入,输出采用标准输出
使用rubydebug显示详细输出
[root@apache bin]# logstash -e 'input { stdin{} } output { stdout{ codec => rubydebug } }'
Settings: Default filter workers: 1
Logstash startup completed
www.baidu.com
{
       "message" => "www.baidu.com",
      "@version" => "1",
    "@timestamp" => "2020-11-18T08:40:57.598Z",
          "host" => "apache"
}


使用logstash将信息输出给elasticsearch
[root@apache bin]# logstash -e 'input { stdin{} } output { elasticsearch { hosts => ["20.0.0.10:9200"] } }'
Settings: Default filter workers: 1
Logstash startup completed
abc123      #输入内容
tom456
123jerry
在logstash收集系统日志
logstash配置文件主要由三部分组成:input、output、filter
[root@apache bin]# chmod o+r /var/log/messages #允许其他用户访问
[root@apache bin]# ll /var/log/messages
-rw----r--. 1 root root 250721 11月 18 16:40 /var/log/message
[root@apache ~]# vi /etc/logstash/conf.d/system.conf
input { #logstash输入:从/var/log/messages输入,类型为system,起始位 置为从头开始
file {
path => "/var/log/messages"
type => "system"
start_position => "beginning"
}
}
output { #logstash输出:输出给elasticsearch(以IP地址指定位置)
elasticsearch {
hosts => ["20.0.0.10:9200"]
index => "system-%{+YYY.MM.dd}"
}
}
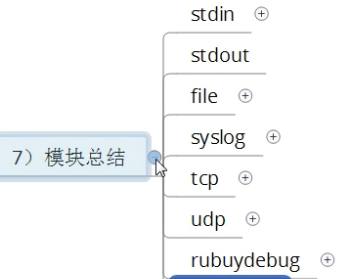
[root@apache ~]# systemctl restart logstash.service模块总结
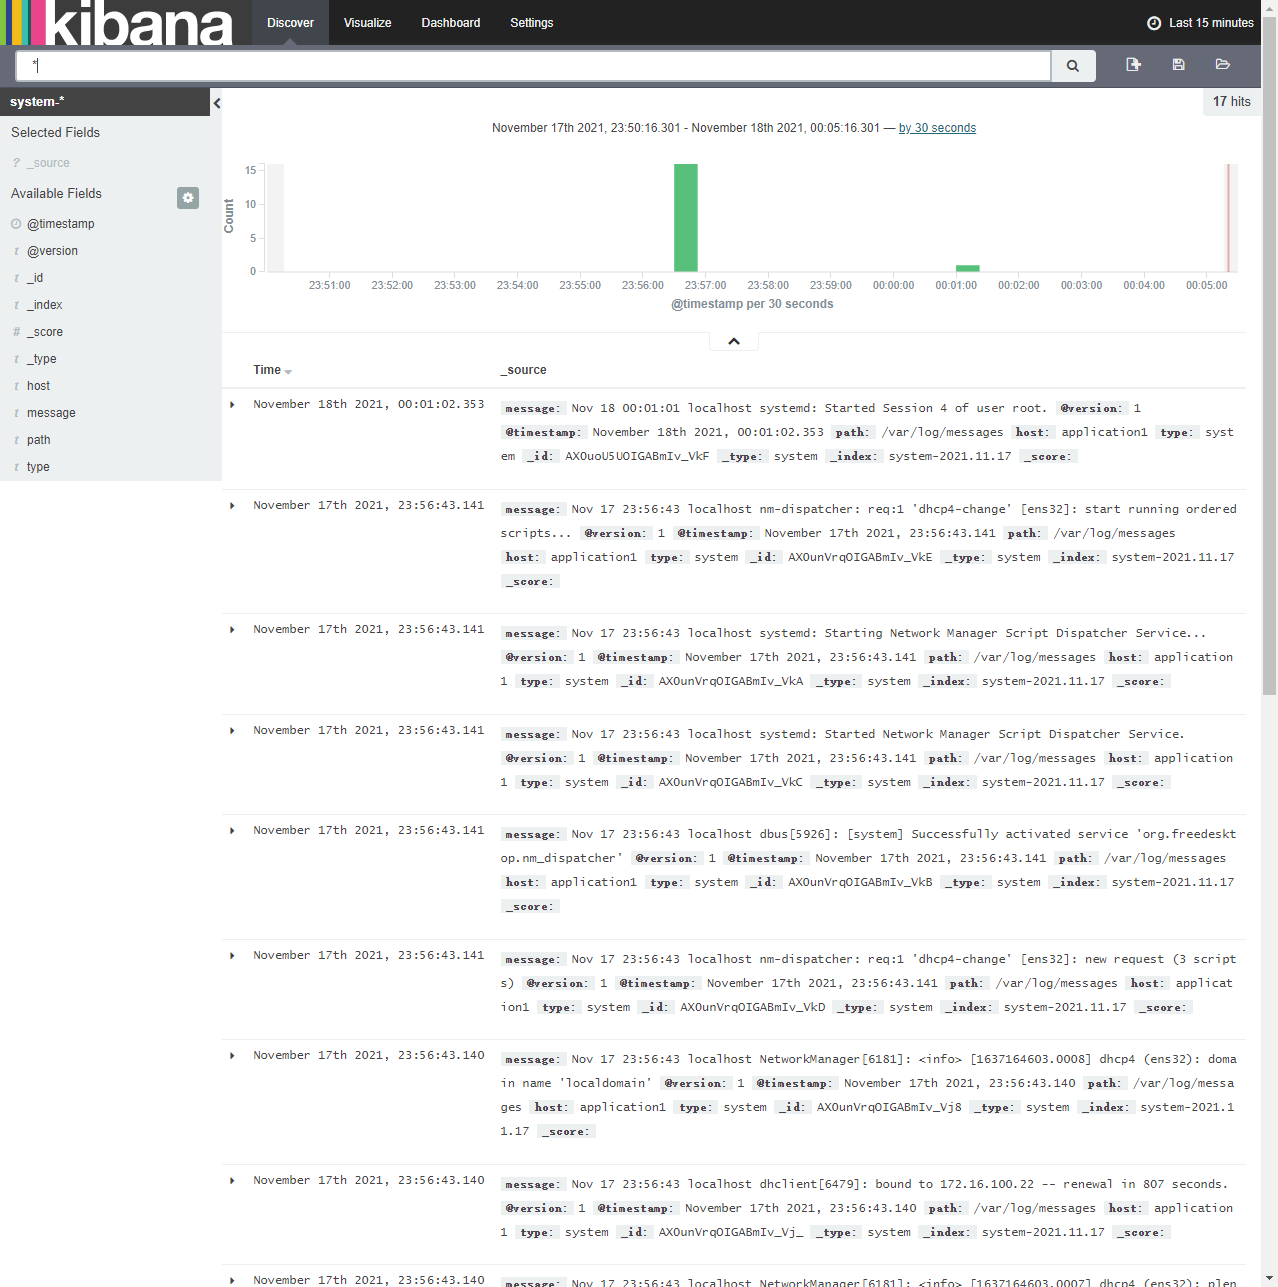
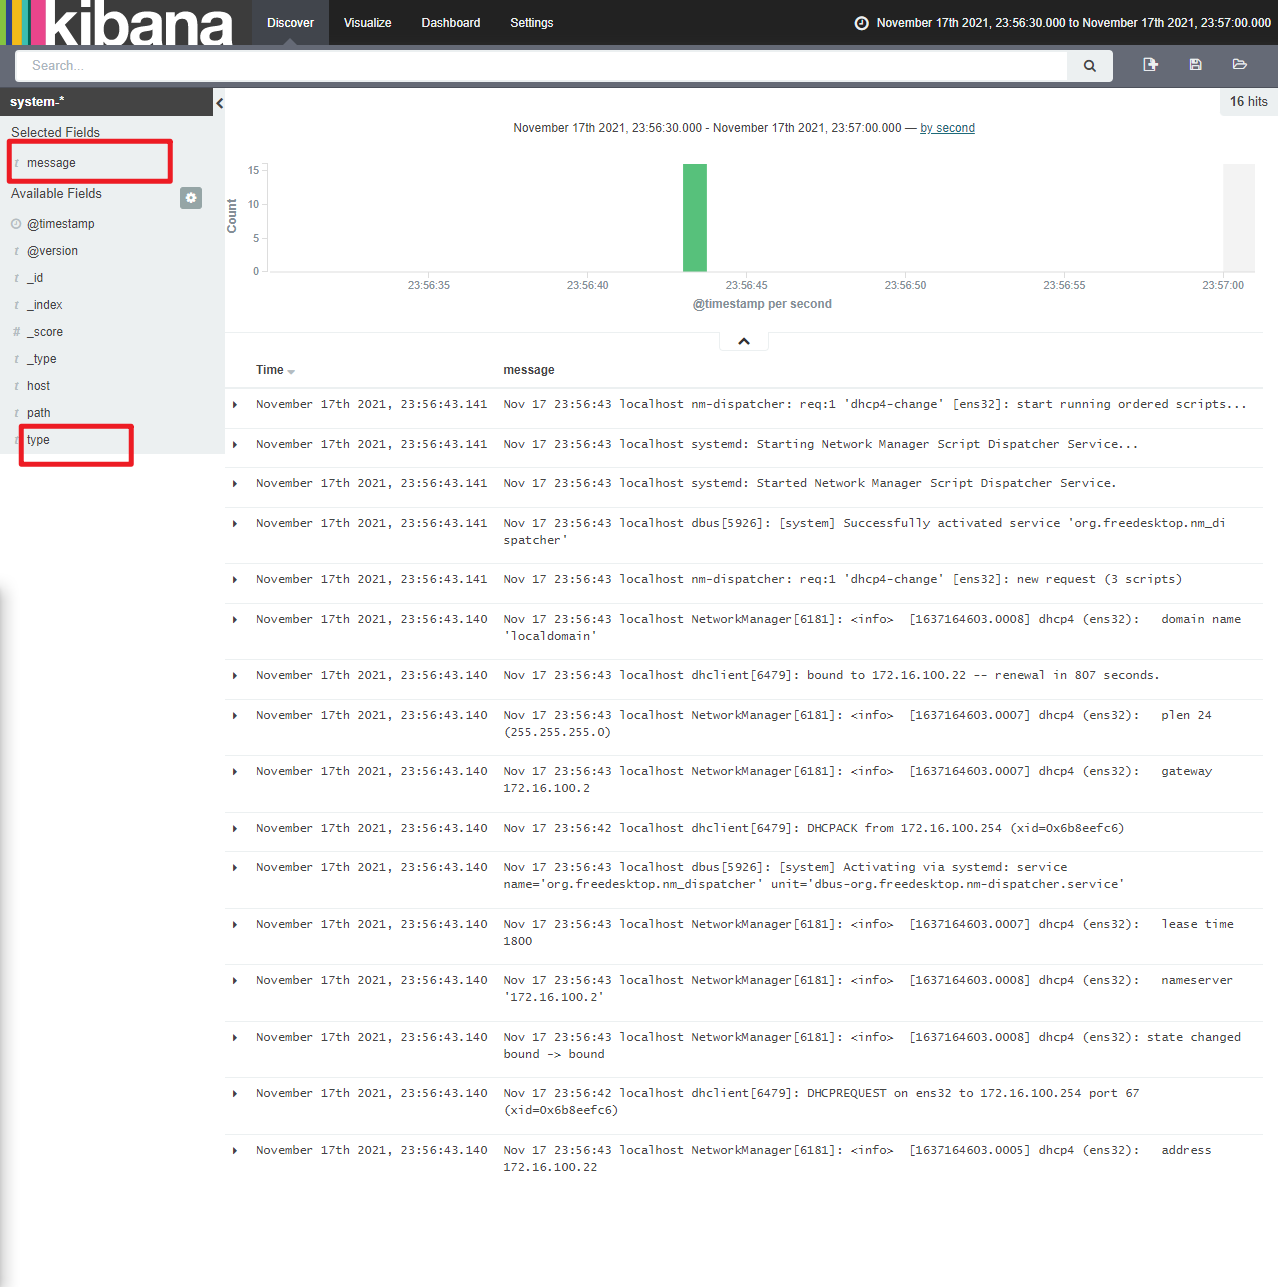
Kibana
添加logstash配置,收集apache服务的访问日志和错误日志中的数据
上传kibana-4.3.1-linux-x64.tar.gz到/root下
wget https://download.elastic.co/kibana/kibana/kibana-4.3.1-linux-x64.tar.gz
[root@node1 ~]# tar zxf kibana-4.3.1-linux-x64.tar.gz
[root@node1 ~]# mv kibana-4.3.1-linux-x64 kibana
[root@node1 ~]# mv kibana /usr/local/
[root@node1 ~]# cd /usr/local/kibana/
[root@node1 kibana]# vi config/kibana.yml
//2行 kibana打开的端口
server.port: 5601
//5行 kibana侦听的地址
server.host: "0.0.0.0"
//12行 和elasticsearch建立联系
elasticsearch.url: "http://20.0.0.10:9200"
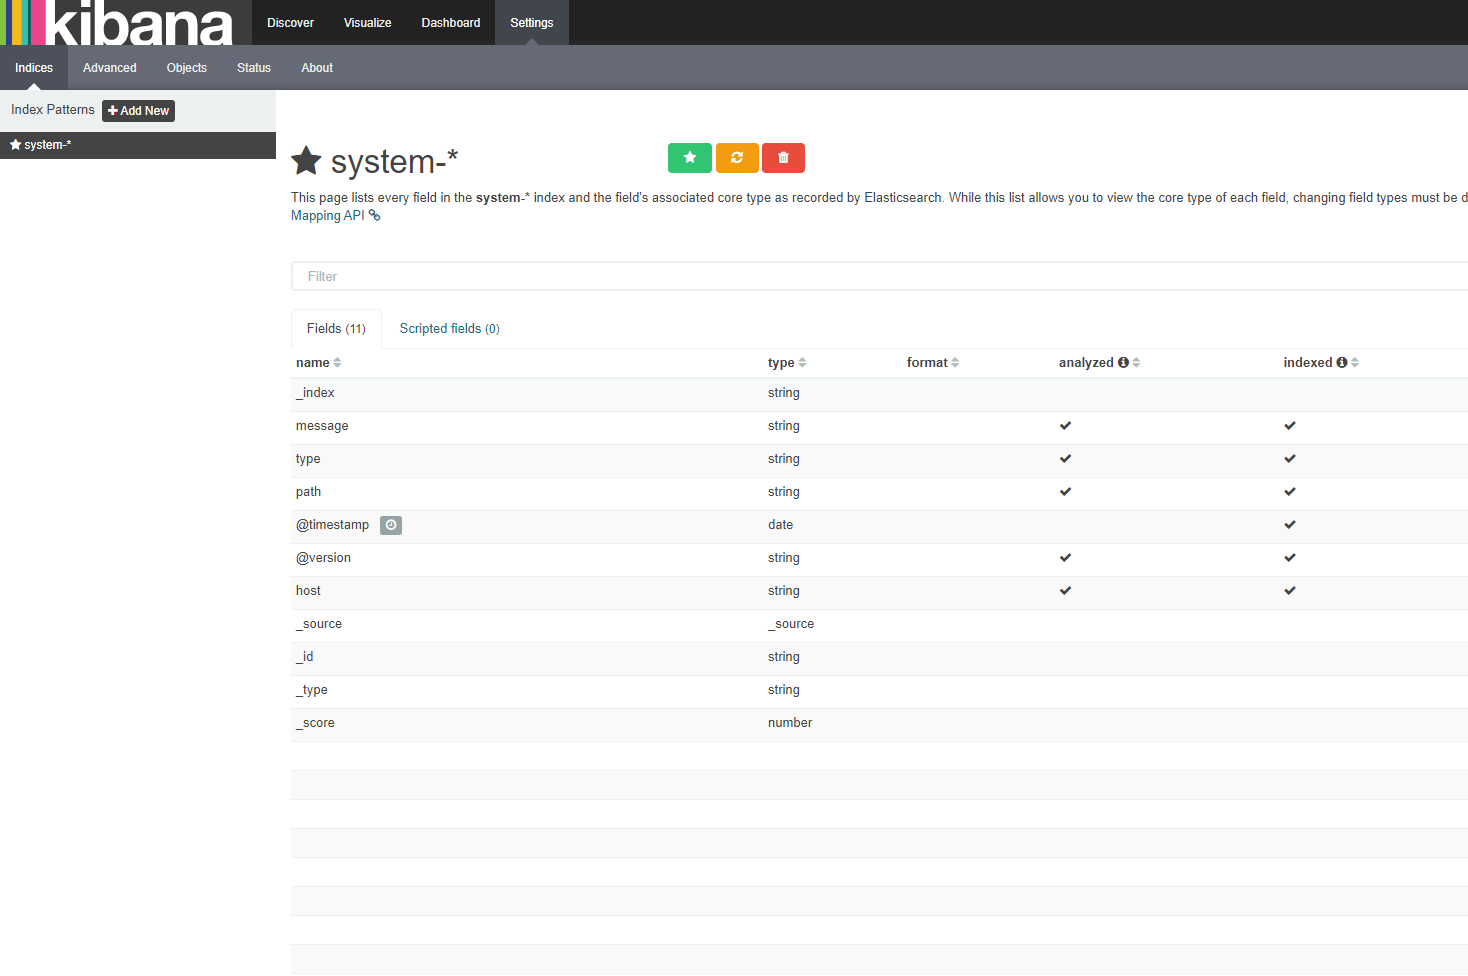
//20行 在elasticsearch中添加.kibana索引
kibana.index: ".kibana"
[root@node1 kibana]# yum -y install screen
启动kibana
[root@node1 kibana]# /usr/local/kibana/bin/kibana[root@apache ~]# cd /etc/logstash/conf.d/
[root@apache conf.d]# vi apache_log.conf
input {
file {
path => "/etc/httpd/logs/access_log"
type => "access"
start_position => "beginning"
}
file {
path => "/etc/httpd/logs/error_log"
type => "error"
start_position => "beginning"
}
}
output {
if [type] == "access" {
elasticsearch {
hosts => ["20.0.0.10:9200"]
index => "apache_access-%{+YYY.MM.dd}"
}
}
if [type] == "error" {
elasticsearch {
hosts => ["20.0.0.10:9200"]
index => "apache_error-%{+YYY.MM.dd}"
}
}
}
[root@apache conf.d]# logstash -f apache_log.conf #指定logstash的配置文件,根据apache_log.conf配置logstash(-f可以不重启加载)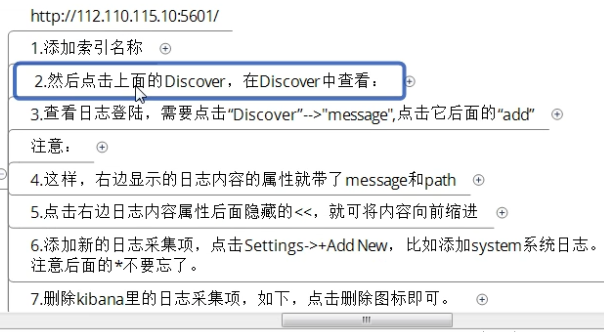
Elasticsearch + Redis
首先从redis这台服务器下手吧
yum install -y redis

关于redis的具体操作以后的文章会讲到

vim /etc/redis.conf
修改
bind 0.0.0.0
保存退出,启动
/etc/init.d/redis start

ss -tanl查看redis启动端口6379
web server (192.168.1.13):
yum install -y httpd
/etc/init.d/httpd start
ss -tanl 查看一下80端口是否启动
安装logstash
rpm -ivh logstash-1.5.4-1.noarch.rpm

vim /etc/logstash/conf.d/full.conf #full.conf这个你可以随意起名字
input {
        file {
                path => "/var/log/httpd/access_log"
                type => "Apache"
                start_position => "beginning"
        }
}

output {
        redis {
                port => "6379"
                host => ["192.168.1.12"]
                data_type => "list"
                key => "logstash-%{type}"
        }
}

保存退出!

测试一下语法有没有错误:
[root@linux-node4 ~]# logstash -f /etc/logstash/conf.d/full.conf --configtest
Configuration OK

没有错误可以启动了
[root@linux-node4 ~]# logstash -f /etc/logstash/conf.d/full.conf
Logstash startup completed
至此,我们可以测试一下,是否把收集到的日志数据发送到了redis。
#redis-cli
127.0.0.1:6379> LLEN logstash-Apache
(integer) 38
127.0.0.1:6379> LINDEX logstash-Apache 1
"{\"message\":\"192.168.1.159 - - [16/May/2018:19:29:39 +0800] \\\"GET / HTTP/1.1\\\" 304 - \\\"-\\\" \\\"Mozilla/5.0 (Windows NT 6.1; WOW64) AppleWebKit/537.36 (KHTML, like Gecko) Chrome/49.0.2623.221 Safari/537.36 SE 2.X MetaSr 1.0\\\"\",\"@version\":\"1\",\"@timestamp\":\"2018-05-16T13:13:48.004Z\",\"host\":\"0.0.0.0\",\"path\":\"/var/log/httpd/access_log\",\"type\":\"Apache\"}"
127.0.0.1:6379>
由此说明已经产生数据到redis了。
接下来在logstash server这台机器上操作
logstash安装不再演示
vim fromredis.conf
input {
        redis {
                port => "6379"
                host => "192.168.1.12"
                data_type => "list"
                key => "logstash-Apache"
        }
}

output {
        stdout {
                codec => rubydebug
        }
}

测试语法是否正确:
[root@linux-node2 conf.d]# logstash -f /etc/logstash/conf.d/fromredis.conf --configtest
Configuration OK
运行:
[root@linux-node2 conf.d]# logstash -f /etc/logstash/conf.d/fromredis.conf
至这里,运行结果会把收集到的日志信息,标准输入至屏幕;
打开浏览器输入" http://192.168.1.13" 刷新几次,你会发现logstach server 这台服务器的屏幕会出现日志滚动信息,都是刚刚刷新收集到的最新日志信息;
最后,在es这台机器上,安装elasticsearch + kibana,安装方法不再演示:
vim /etc/elasticsearch/elasticsearch.yml
cluster.name: myes
node.name: "linux-node1"
保存退出,并启动

编辑kibana的配置文件:
/usr/local/kibana/config/kibana.yml
elasticsearch_url: " #这一项非常重要

启动kibana:
/usr/local/kibana/bin/kibana

复制一个终端
ss -tanl 查看5601端口是否开启
浏览器输入" http://192.168.1.10:5601"打开kibana界面
接下来还返回logstash server服务器
前面,我们是将结果标准输出到了屏幕,这次我们需要把结果输出到elasticsearch服务器
vim /etc/logstash/conf.d/fromredis.conf
修改为:
input {
        redis {
                port => "6379"
                host => "192.168.1.12"
                data_type => "list"
                key => "logstash-Apache"
        }
}

output {
        elasticsearch {
                cluster => "myes"
                index => "logstash-%{YYYY.MM.dd}"
        }
}

测试语法,没有问题就运行:
[root@linux-node2 conf.d]# logstash -f /etc/logstash/conf.d/fromredis.conf --configtest
Configuration OK
[root@linux-node2 conf.d]# logstash -f /etc/logstash/conf.d/fromredis.conf
想要知道是否成功的信息输出到了es上,可以验证
[root@linux-node1 ~]# curl -XGET 'localhost:9200/_cat/indices'
yellow open .kibana             1 1   2 2  10.3kb  10.3kb
yellow open logstash-2018.05.16 5 1 389 0 170.5kb 170.5kb
[root@linux-node1 ~]# curl -XGET 'localhost:9200/logstash-2018.05.16/_search?pretty'
接下来在kibana上显示:
浏览器" http://192.168.1.10:5601/"
面试题
ELK插件
https://blog.csdn.net/sinat_35930259/article/details/81052139
更新日志
2026/3/27 18:22
查看所有更新日志
f6a95-于2dc44-于13b96-于392a5-于